As a result of the concern of researchers, teachers, and trainers from
Martinique, Guadeloupe, and Haiti
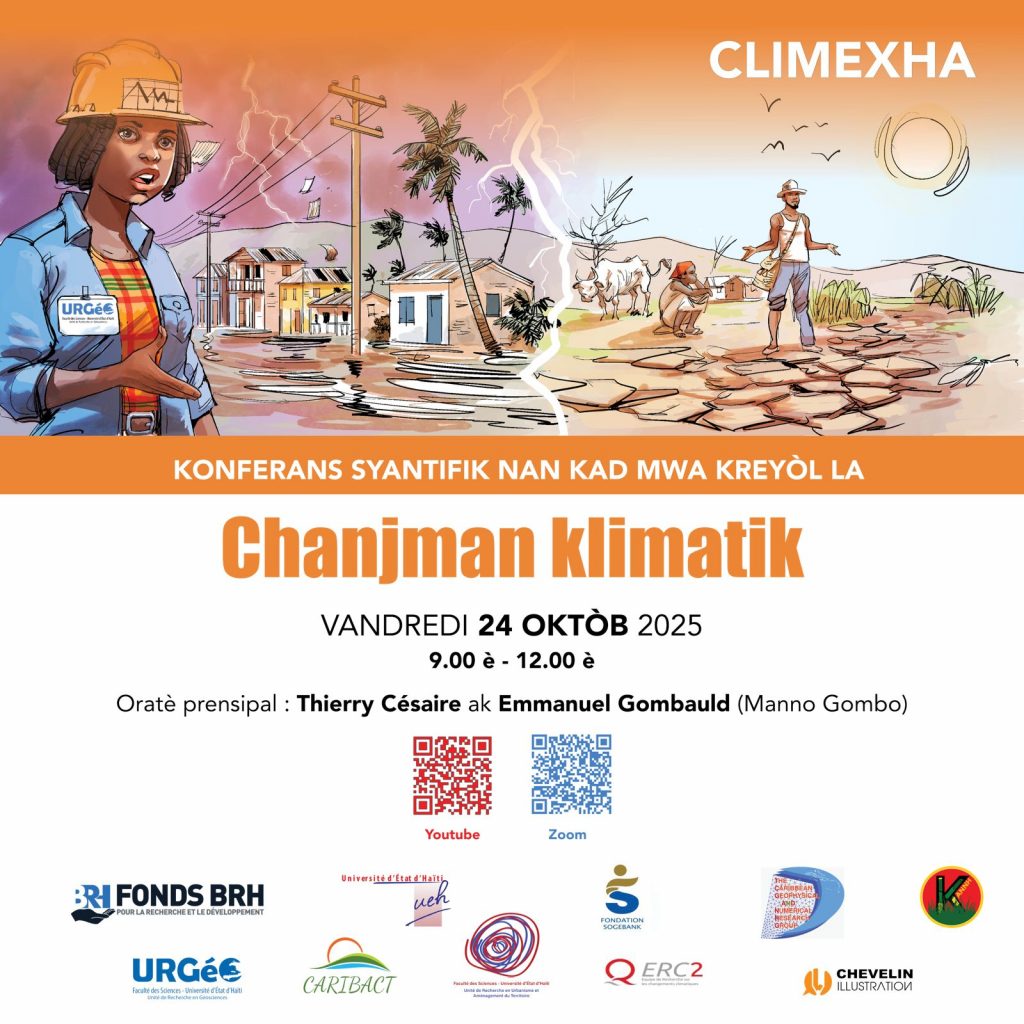
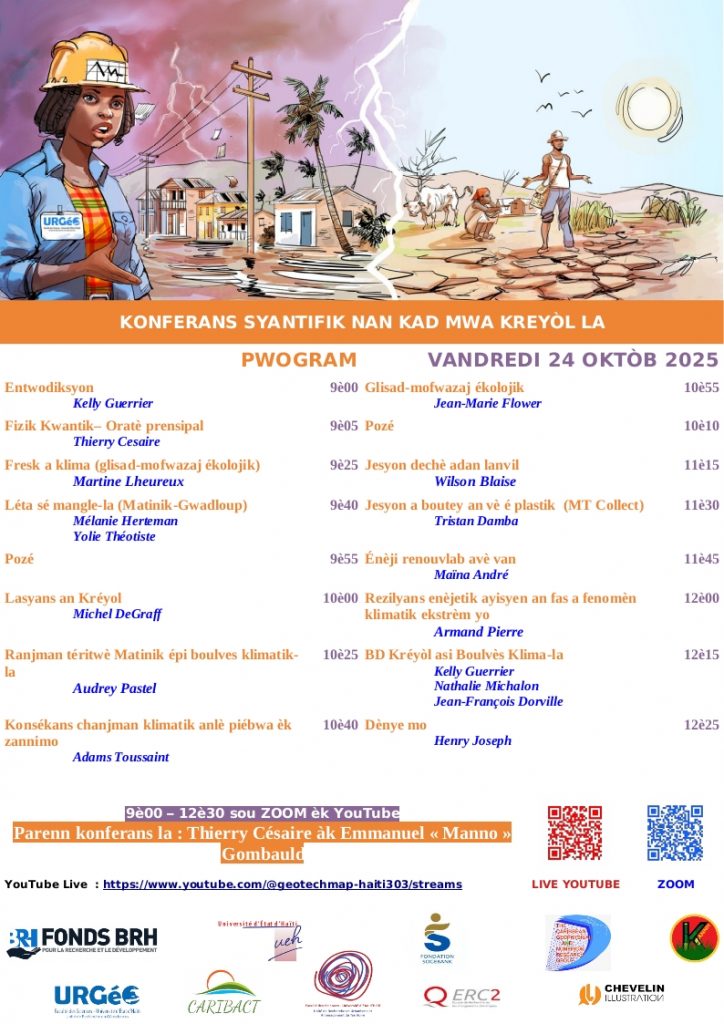
to contribute to the use of Creole in science, a virtual conference (web conference) is being organised on
Friday, October 24, 2025, from 9:00 a.m. to 12:30 p.m.
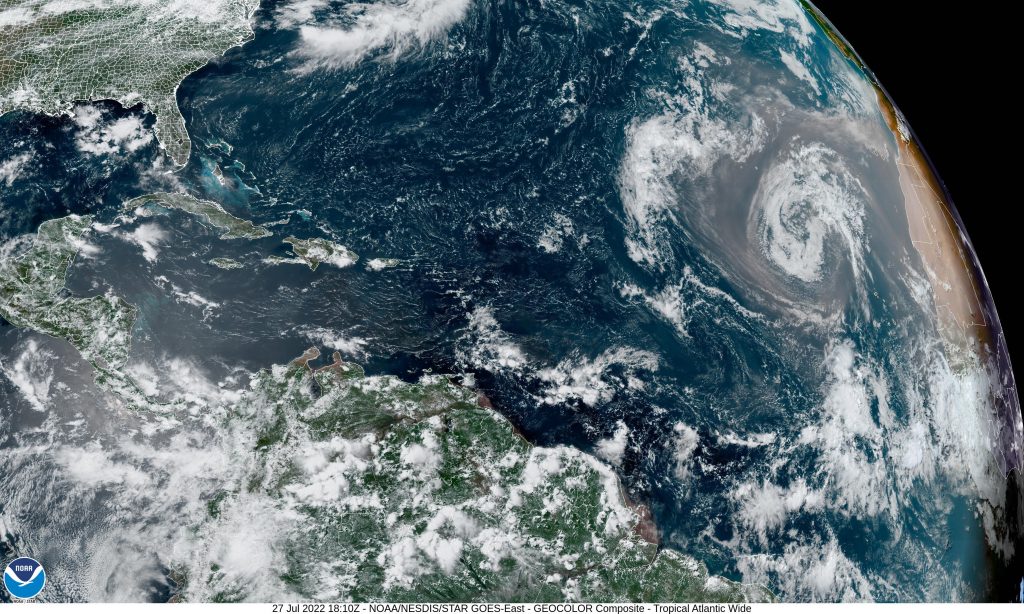
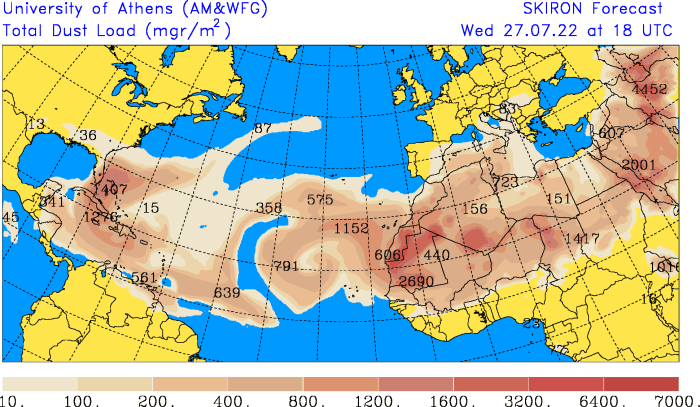
on the subject of natural risks in the Caribbean and
Climate Change.
This is the third consecutive year that such a conference has been organised
as part of Creole Month
After « Natural Risk Reduction in 2023 », et « Rainwater in the context of climate change » the theme addressed for this new edition is:
Chanjman Klimatik
(Climate Change)
With the participation and sponsorship of:
- Thierry Césaire, Lecturer at the University of the Antilles, member of the GTSI
- Emmanuel Gombauld, known as “Manno,” a journalist specializing in Creole
He will be in charge of introducing us to quantum physics and related sciences and technologies. They will also discuss with us the difficulty of translating science into Creole.
We invite you to this webinar on Friday, October 24, 2025, between 9:00 a.m. and 12:15 p.m. (Saint Lucia, Martinique, Guadeloupe, and Haiti time),
and thank you for sharing this invitation with as many Creole speakers and those curious about the language as possible.
The organizer
- Dr. Kelly Guerrier (URGéo-URBATER-CLIMEXHA/UEH, Haïti) kelly.guerrier@ueh.edu.ht
- Dr. Jean-François M. Dorville (TCGNRG, Guadeloupe) jf.dorville@tcgnrg.com +590 690 290324
- Dr. Nathalie Michalon (CRILLASH/UAG, Martinique) nathaliemichalon.kannh@gmail.com
The half-day program
Learn more
The kit press is available on this link
Kit press for Sciences in the Creole Language 2025
How to connect
Zoom link : https://us02web.zoom.us/j/85760250694?pwd=WnJXre3vaViMG8C8o34OiX2RoV7JwY.1
The connection will be open from 8:45 a.m. (Port-au-Prince time, UTC-4)
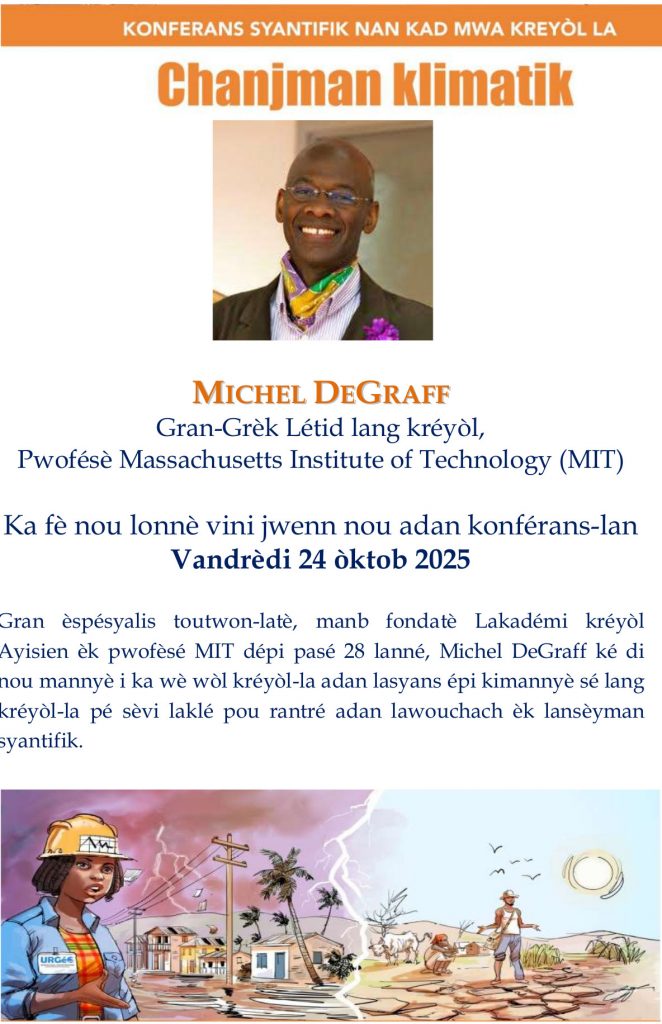
In addition to the initial speakers,
MICHEL DEGRAFF, Creole language specialist and Professor at the Massachusetts Institute of Technology (MIT), will honour us with his presence on Friday, October 24, 2025, at the conference “Lasyans an Kréyòl”
Michel is a world-renowned specialist, founding member of the Haitian Creole Academy, and professor at MIT for 28 years, Michel DeGraff will explain how he views the role of Creole in science and how the Creole language is a key element for accessing scientific research and teaching.
Replay
The conference is available in its entirety on the URGéo YouTube page.
The conference is also available as split presentation, it can be found on the dedicated playlist of the KaNNH Agency.